weight & balance
front-end development (reactjs)

overview
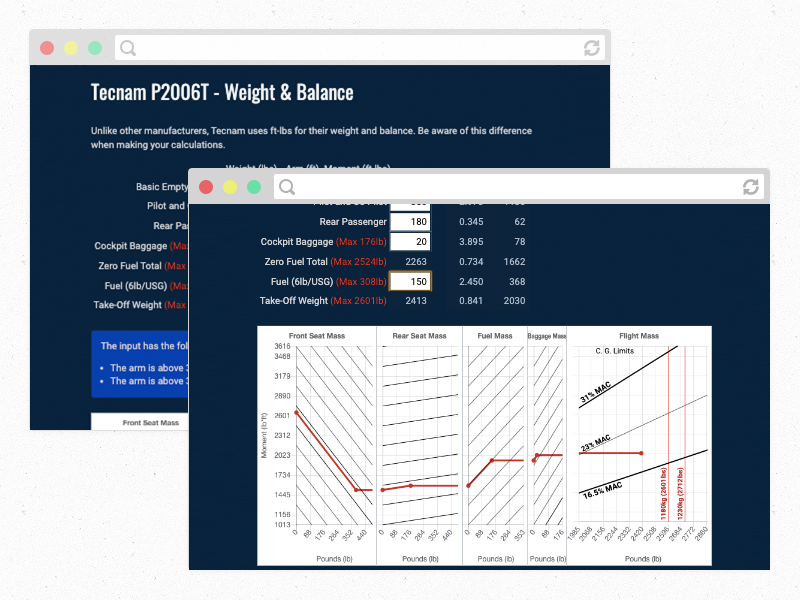
The weight and balance graphic is a supplemental learning tool to help teach student pilots how to balance the weight on their airplane before the flight. Compared to other airplanes, the Tecnam P2006T follows a different charting method. This meant that the model could not be included with the current implementation used by Sharper Edge Train Solutions Ltd. As a result, I was responsible for creating a new weight and balance graph.
what is a weight and balance graph?
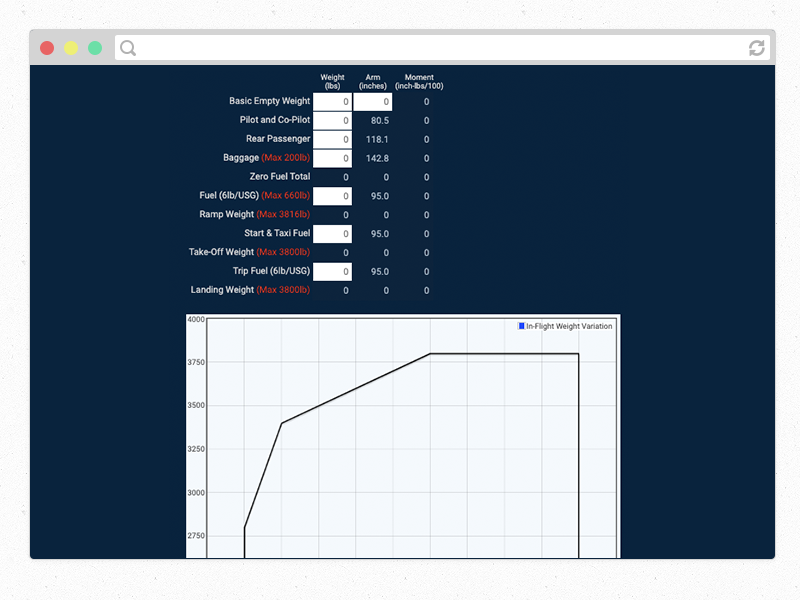
The table multiplies the weight added to the plane by the length of the arm (distance from datum) to calculate the moment of the applied weight. This moment is then graphed to give the pilot a visual indicator of whether or not their plane is within the balance requirements.
research

The original weight and balance was built 2 years prior to this project. It used jQuery with a clunky table implementation that made it difficult to propagate into another plane. To address this flaw, along with the fact that the graph implementation was completely different, I decided to utilize ReactJS for the new weight and balance.
proposal


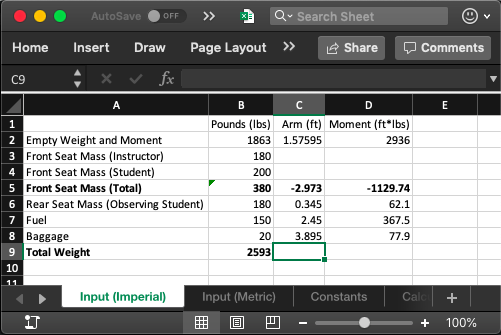
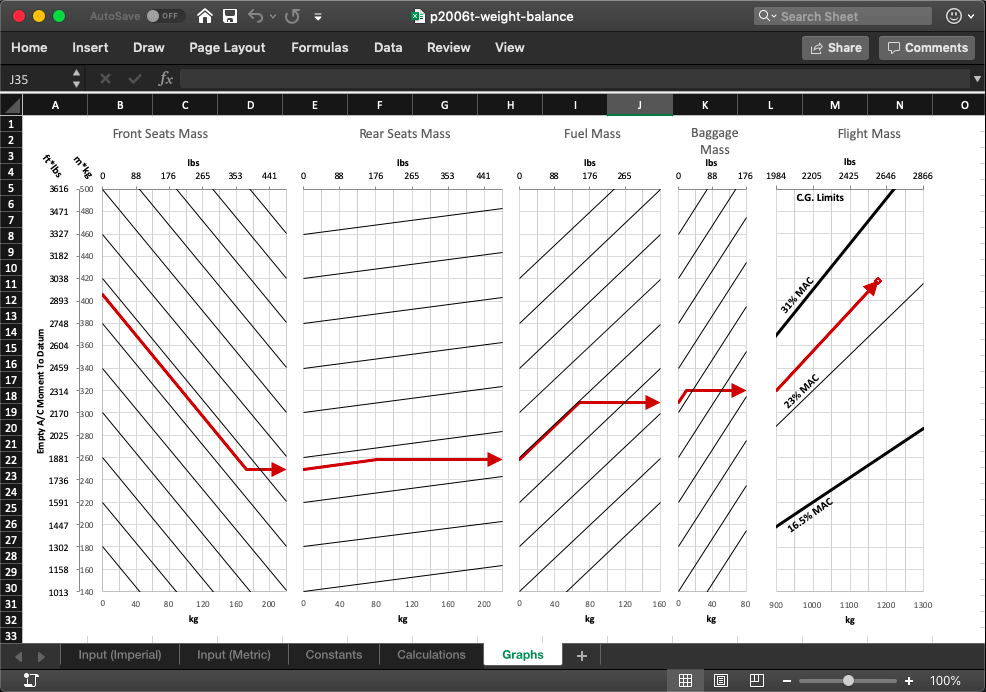
Before starting implementation, I built a sample of the weight and balance in Excel to confirm that I understood what the problem was and how it needed to be solved. This excel document originally served as the basis for the ReactJS implementation. Now, the authors find the document useful to write weight and balance questions for the preparation guide.
design / implementation
After getting approval on the function of the Excel prototype, I began building the weight and balance with ReactJS. In order to build the project, I first needed to break down the application into its base components:
- Table
- Row
- HeaderCell
- ReadOnlyCell
- InputCell
- Row
- Graph
- TotalGraph
resolving dependencies
testing / struggles
While building the weight and balance, I came across the following issues:
- The original graphs were calculated in metric. For better plotting accuracy, I decided to implement the graphics in metric as well. Then, the front facing HTML translated the metric measurements to imperial (since Canadian pilots use the imperial system).
- Because this is learning material for students, it was important that the error messages didn't just "fix" potential problems. The messages needed to explain why certain calculations were incorrect to serve as a basis for learning.
- The lack of a back-end meant that the data is stored with the ReactJS app (instead of pulled down with an AJAX call).
final design
In the final design, a student can insert their airplane's basic empty weight and any other weights that they will fly with. If any errors occur in their input, the app will highlight the cell red and give an appropriate error message. As the student inputs their data, the graphs automatically update and give them instant feedback.
what would i improve / change next time?
- Instead of using DFS on paper to generate the dependency graph, I would implement DFS into ReactJS. This would make the app easily useable with other airplanes.
- Implement AJAX call to pull the data from a back-end. This will make updating the tables smoother.
- Allow users to switch between metric and imperial units. This enables the use of these learning materials outside of Canada.
